Activate trace
|
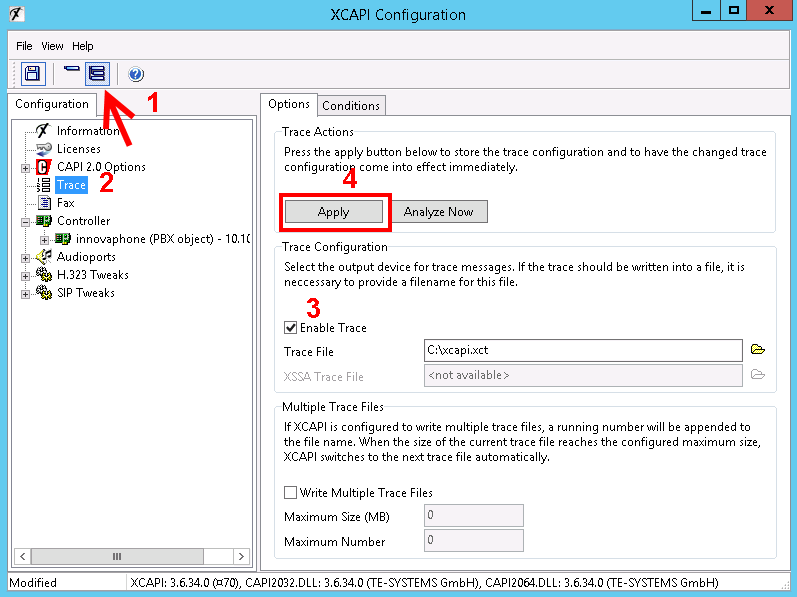
Start the "XCAPI Configuration" via the windows startmenue and activta the "Advanced" viewing.(1) Click "Trace" in the right menu. (2)
Activate the option "Enable Trace" (3), select a directory with write access for the current user account, and click Apply.(4) The log data is saved as an .xct file. Enter the path under Trace File or click the browser button and go to the directory where you want to save the file. The file can then be viewed using the Analyze Now option, which will open XTraceAnalyzer.
Note: XCAPI will create a backup of the latest trace file before overwriting it, so you don't have to worry about using different file names.
For systems that operate under heavy load, there is an option to "write multiple trace files". A high number of concurrent calls will generate a lot of trace data, and you should try to keep the file size below 1 GB. This can be accomplished using the "Maximum Size (MB)" option. For the mistake search in connection with ixi-UMS Business you should always provide 2 separate trace-files. The (faulty) process start with: §the XCAPI Test Tool §with ixi-UMS Business
How to create a trace file: 1.Stopp ixi-UMS Kernel and close the XCAPI Test Tool 2.Open the configuration dialog of the XCAPI and enable Trace 3.Start ixi-UMS Kernel or the XCAPI Test Tool and repeat the procedures that lead to the problem 4.Finish the application as soon as the error has occurred. 5.Disable the trace function.
|
Version 7