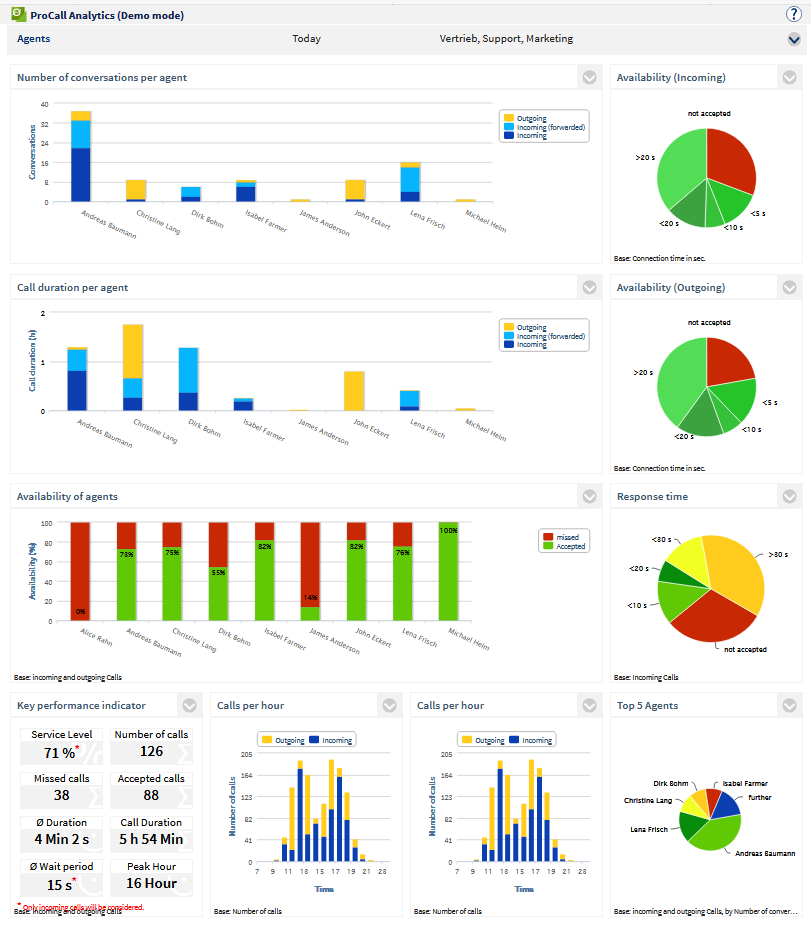
ProCall Analytics Dashboards
![]() This button will open the configuration section.
This button will open the configuration section.
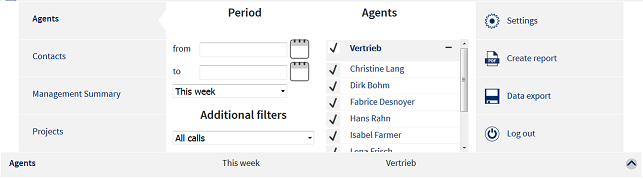
There is a list of available dashboards on the left. The currently active dashboard is highlighted in bold font. Click on the text to change the dashboard. ProCall Analytics provides four dashboards: Contacts, Employees, Projects and a Management Summary. These are described in more detail in the next chapter with their evaluations.
Dashboard Filter
Now choose a time period that you want your evaluation to relate to, e.g. last month.
Here you can either choose from a list of predefined time periods or a separate time range via the calender symbol or the input field.
There is a filter option below the time period selection to select only external calls, only internal calls or all calls.
Now select the teams or employees. You can select Contacts, Projects or Comparison Periods depending on the selected dashboard.
The TOP x Filter refers to the call frequency. If several contacts or projects are available with the same number of calls, they are sorted alphabetically.
Update
As soon as you have configured the setting, the evaluations of the dashboard are updated. If a call event occurs during the selected time period (e.g. "today") for one of the selected employees or a team, the evaluations are automatically updated in realtime.
Version 7.8