Settings and configuration of an evaluation
 The symbol is located in the right upper corner of each evaluation.
If you click on this symbol, the following dialog opens:
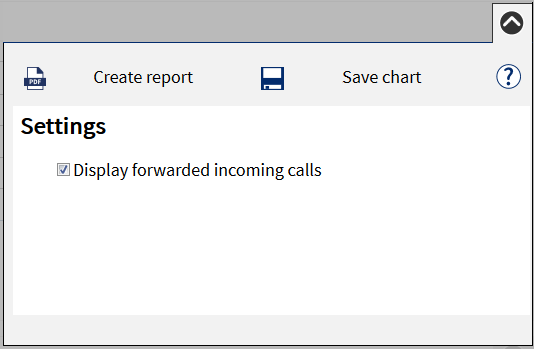
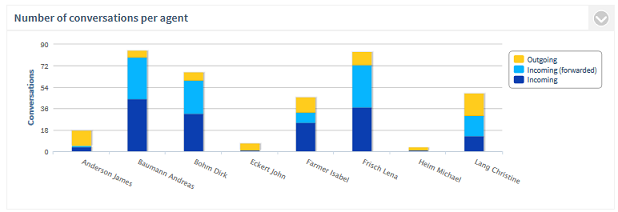
Settings and configurations of the graphic
For certain evaluations, you can change specific parameters. So it is possible to specifically adapt this evaluation.
 |
Export data |
Here you have the option to export all data of the evaluations of this dashboard in CSV/XML or as a HTML table, also optionally as a graphic in PNG format.
In this way, further processing using third party applications such as Excel is possible.
The dialog with the export preview opens. On the left side of the dialog, there is a preview of the export format. On the right side, you can select options for the export.
The following options are available:
- Format
Choose the data export format here. CSV/XML/HTML table - Add export report
Select whether a report should be in the archive with the export files that describes this (time period of the data (from/to), filter, evaluation settings).
Options CSV
- Column header in first line
If this option is active, the first line of the export file has the header. The data starts from the second line. - Separators
Characters that are used as separators between the fields (usually ';') - Field qualifiers
Empty: The values are only set in " when required, if a " or ' is selected, the value is always limited by this character.
Options XML
- Tag identifier
Here it can be defined whether the XML tags are generated in large, small or mixed.
Optional HTML table
- Add class attributes
All elements of the HTML table are provided with class attributes. It is now possible to freely define the columns and lines via css (column width, background color,...)
Evaluations to be exported
- Here you can define for each evaluation whether only the data should be exported or if the evaluation should also be provided as a PNG graphic.
With the "Export data" button, the export data is generated and then prepared as a ZIP archive for download.
 |
Create report |
With this option, you can create a report as a PDF document via the entire dashboard or individual evaluations. A print dialog opens. On the left side of the dialog there is a report preview. On the right side, the options for the report creation are selected.
The following report options are available:- Print cover sheet
If this option is active, the cover sheet is added as the first page of the report. For the generation of the cover sheet, the cover sheet template is used. - Diagram
If this option is active, the evaluation is output as a graph in the report.- Data label
The numerical values are output in the diagram. - Percentage
The percentage value is identified if available.
- Data label
The data of the evaluation is output as a data table in the report.
If this option is active, a report summary is added as the last page of the report. For the generation of this cover sheet, the final page template is used.
-
Orientation
Here it is defined whether the report document should be created in portrait or landscape format. -
Paper format
Define the paper size on which the report should be optimized. A2/A3/A4/Letter -
Footer
Define what should be specified in the bottom line of each page here. "Page x of y", "page x" or the date of the report creation are available.
-
Language of the report
Here you can define the language in which the report should be created. The report template of the language is used. -
Cover sheet page template
If there are several templates for your reports, you can define which should be used for the creation of the cover sheet page here. -
Report pages template
If there are several templates for your reports, you can define which should be used for the creation of the report pages here. -
Final page template
If there are several templates for your reports, you can define which should be used for the creation of the final page here.
With the Create report button, the report is generated and then displayed on a new browser page in the PDF viewer or provided for download.
Version 7.8